
Meta's Own Numbers Show Growth—But Not Which AI Caused It
Meta's Q2 2026 ad revenue rose $12.8 billion year over year. Its impression, price, and Advantage+ figures still cannot isolate a Muse contribution.

Meta’s advertising business grew sharply in the second quarter of 2026. Its Form 10-Q reports $59.363 billion of advertising revenue, up from $46.563 billion a year earlier. That is a $12.800 billion increase; the filing describes the year-over-year change as 27%. It also reports more ad impressions and a higher average price per ad across Family of Apps.
Those numbers establish business growth. They do not establish how much of that growth was caused by Muse, AI creative, Advantage+ automation, or a business-facing agent. The product names appear in Meta’s marketing and earnings discussion, but the filing does not divide the revenue change into product-level causal contributions. A large annualized Advantage+ figure is evidence of that solution family’s reported scale, not a missing Muse revenue line that can be added to the quarter.
The revenue bridge the filing actually gives
The 10-Q’s advertising row is denominated in millions of US dollars. For the three months ended June 30, it lists $59,363 million in 2026 and $46,563 million in 2025. Subtracting the two produces $12,800 million. Dividing that change by the 2025 base gives about 27.49%; Meta’s prose reports 27%. The calculation is a year-over-year change in recognized advertising revenue, not a return on an AI investment.
Meta separately reports $60.80 billion of total company revenue, up 28% year over year. Total revenue is a broader line than advertising revenue. Swapping the 28% company rate into a sentence about ads would make the comparison look cleaner than the source permits.
| Measure | Q2 2026 source value | Unit and period | What it establishes |
|---|---|---|---|
| Advertising revenue | $59.363 billion | Recognized revenue, quarter ended June 30 | The advertising line grew $12.800 billion from Q2 2025. |
| Advertising revenue change | 27% reported | Year over year, same quarter | Growth in the ad revenue line, with no product-level attribution. |
| Total company revenue | $60.80 billion | Recognized revenue, Q2 2026 | Company-wide scale; it is not an AI-agent revenue line. |
| Total company revenue change | 28% reported | Year over year, same quarter | A different, broader denominator from advertising growth. |
The filing says the advertising revenue increase came with higher ad impressions delivered and higher average price per ad. Its Q2 figures are 14% more Family of Apps ad impressions and a 12% higher average price per ad, each compared with Q2 2025. These are reported aggregate movements, not a controlled experiment in which AI was switched on for one audience and off for another. A rough multiplication of rounded impression and price percentages would not be an exact decomposition of the dollar line: the published rates are rounded and the filing discusses mix and other drivers. It certainly would not tell us which model or automation tool earned the increase.
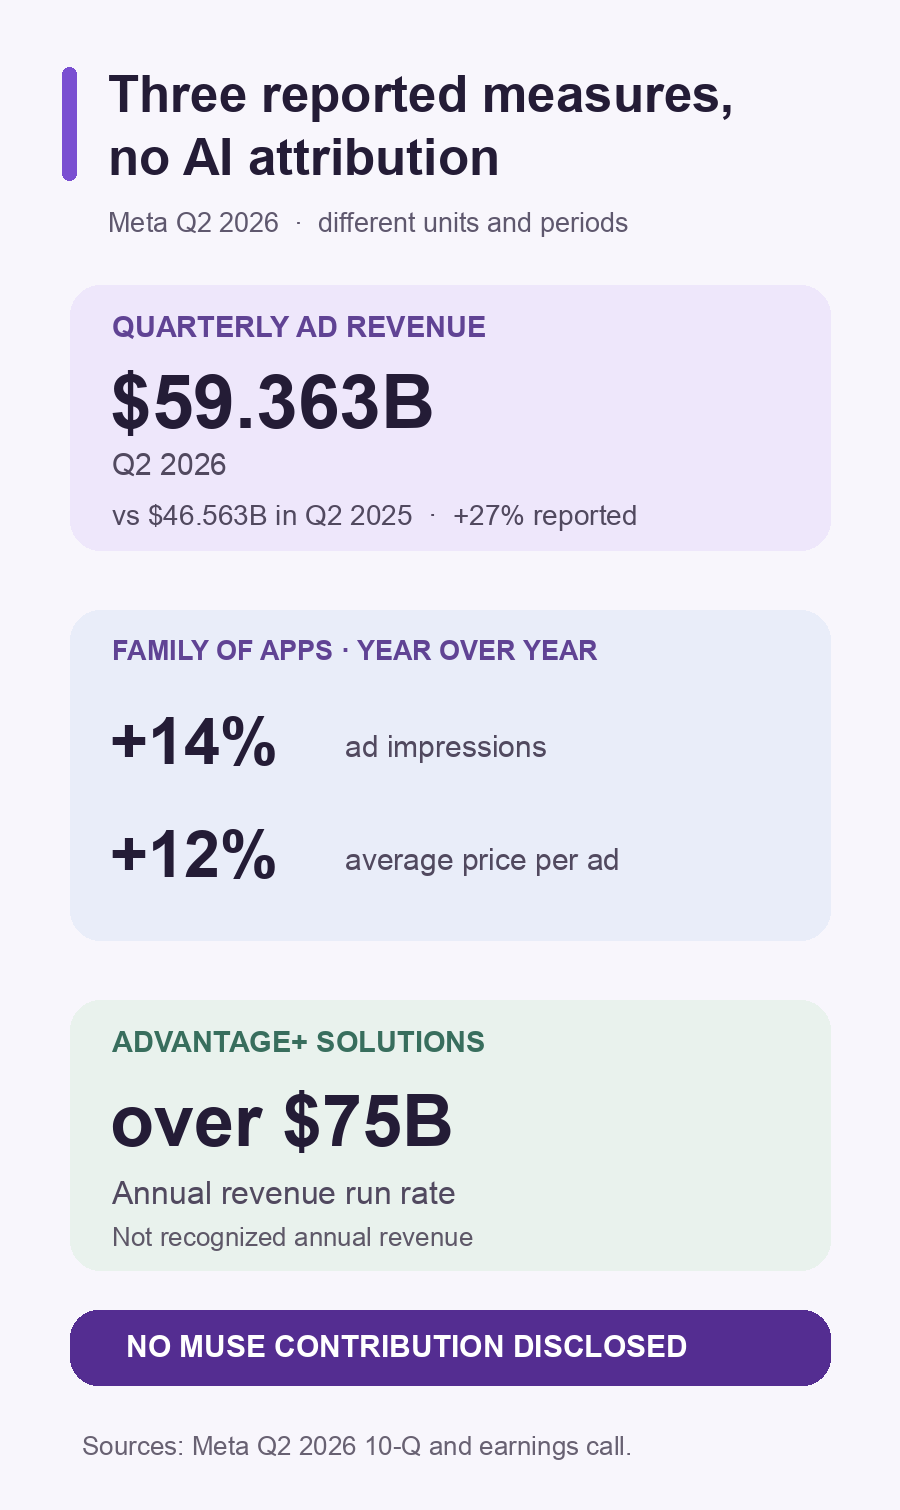
Figure 1. Meta reported Q2 2026 advertising revenue of $59.363 billion, up 27% year over year, and Family of Apps ad impressions and average price per ad up 14% and 12%. The over $75 billion Advantage+ solutions figure is an annual revenue run rate, a different measure and period. The filing and call do not disclose Muse-attributable revenue or a causal AI contribution.
Why the Advantage+ number cannot fill the gap
In Meta’s Q2 earnings call, management said Advantage+ end-to-end solutions had reached over $75 billion in annual revenue run rate. The phrase matters. A run rate is an annualized pace reported at a point in time; it is not the amount of recognized revenue in Q2, not a full year of realized sales, and not Muse-attributable revenue.
It also has a different product scope. Advantage+ refers to an advertising solution family. The 10-Q advertising line covers a broader company revenue category. The public documents do not provide a table that lets a reader subtract the Advantage+ pace from recognized quarterly ad revenue or treat it as a new, additive revenue pool. The safe comparison is qualitative: Meta reports a large Advantage+ pace and a growing advertising business. The sources do not measure how much Advantage+ caused the latter to grow.
The same logic applies to user and business adoption statements in earnings commentary. A count of businesses using a creative tool or a Business Agent describes uptake under that product’s definition and time window. It is neither dollars of recognized revenue nor a set of incremental conversions. Without a common cohort, overlap, baseline, and outcome window, those counts cannot be arranged into a single “AI marketing funnel.”
| Term | Denominator to keep visible | A tempting but unsupported substitution |
|---|---|---|
| Quarterly advertising revenue | Recognized dollars from advertising in one quarter | Annual revenue or product-level AI revenue |
| Ad impressions | Ads delivered across Family of Apps | Customers, conversions, or spend caused by Muse |
| Average price per ad | Aggregate realized price per delivered ad | A universal advertiser CPC or a product lift test |
| Advantage+ annual revenue run rate | Company-reported annualized pace for a solution family | Q2 recognized revenue or an incremental $75 billion |
| AI tool or agent adoption | Users or businesses under a product-specific usage definition | Purchases, cohort overlap, or causal revenue contribution |
What would identify an AI contribution?
There are two distinct questions. An investor might ask how much revenue Meta books from a named solution; that requires a disclosed product-level revenue definition and a consistent period. An advertiser might ask whether an AI feature improves results; that requires a campaign comparison with a declared outcome, stable audience and placement rules, and enough control over budget, creative, seasonality, and attribution to interpret the difference. Neither question is answered by dividing one company-wide growth percentage by another.
For a practical buying decision, the useful request is specific: show the same campaign objective with and without the AI feature, define the conversion and attribution window in advance, and report incremental business outcomes alongside spend. If the vendor only offers a run rate, a usage count, and aggregate impression growth, those are product and company signals—not an estimate of incremental return for the advertiser.
Method, limits, and correction policy
This analysis uses Meta’s retained Q2 2026 Form 10-Q and earnings transcript. Violet independently extracted the advertising row, recomputed the $12.800 billion year-over-year difference, checked the filing’s reported 27% wording, and kept the transcript’s over qualifier and annual run-rate unit. The portrait figure is original work generated from a frozen source-hashed claim map; it does not reproduce Meta creative or put unlike values on one quantitative scale.
The analysis cannot isolate Muse, Advantage+, creative tools, or Business Agents as causes of revenue growth. It does not estimate incremental sales, campaign lift, or product cohort overlap. The retained claim map is docs/research/2026-09-23-c5-m9-m10-claim-map-v1.json; the media provenance is docs/research/figures/m9-growth-attribution-media-v1.figure.json. A revised filing, clarified run-rate definition, or source correction would trigger a dated recheck of the affected number and figure.
Bring the market problem into focus.
Turn social and market signals into an ecosystem-growth, go-to-market, or technical engagement built around the work your team needs.
Explore engagements