
What Meta's Reels Performance Evidence Actually Measures
Meta's Reels ad page pairs a 2023 purchase survey with an undated 15-test creative analysis. Their populations, outcomes, and limits are different.

Two numbers on Meta’s Reels ads page can sound like one sweeping case for the placement. The page says 79% of surveyed people reported purchasing a product or service after watching Reels. It also says campaigns with a specified 9:16 video creative had 34.5% lower cost per result than image-asset campaigns in a Meta-described analysis. They are not two measurements of the same audience, purchase outcome, or time period.
The first is a Meta-commissioned GWI survey from 2023. The second is an analysis of 15 Reels-only creative split tests whose date is not stated in the retained page footnote. Neither establishes an incremental purchase effect for Reels as a whole or a current cost-per-result target for every advertiser. The useful reading is narrower: one result describes what a qualified survey sample said it had done; the other describes a format comparison under particular creative conditions.
The 79% figure is a survey response
Meta’s footnote defines the base as 6,758 heavy short-form-video consumers, ages 16–64, in Brazil, Germany, India, Japan, South Korea, the United Kingdom, and the United States. Respondents used Reels at least weekly. The footnote identifies the research as Meta-commissioned GWI, 2023.
That population matters as much as the percentage. The 79% is not a share of all internet users, all Reels viewers, or people shown a Reels ad. The statement asks about a purchase after watching Reels; temporal order and self-report do not reveal whether the Reel caused the purchase, whether an ad was involved, what was bought, or how much was spent. A marketer cannot turn the survey number into a conversion rate for a planned campaign.
The survey can still tell a useful descriptive story: people who regularly watch short-form video report that shopping sometimes follows that activity. It cannot measure the incremental sales that would disappear if an advertiser stopped buying Reels.
The 34.5% figure is a creative comparison inside Reels
The separate page claim reports 34.5% lower cost per result. Its footnote describes a global analysis of 15 split tests of Reels-only campaigns. One side used a still image asset. The other used 9:16 video with sound, with key messages inside the safe zone. The described advertisers included ecommerce, retail, and consumer packaged goods, including small and medium businesses.
This is an evidence claim about a specified creative format within Reels-only campaigns. It is not a Reels-versus-feed test and not a claim that every 9:16 video will beat every image. The retained footnote does not identify the test dates, an absolute cost-per-result baseline, a uniform definition of “result,” or enough details to predict what the effect would be for a different advertiser. Meta reports high statistical confidence for the analysis, but that does not fill in those missing scope and transferability details.
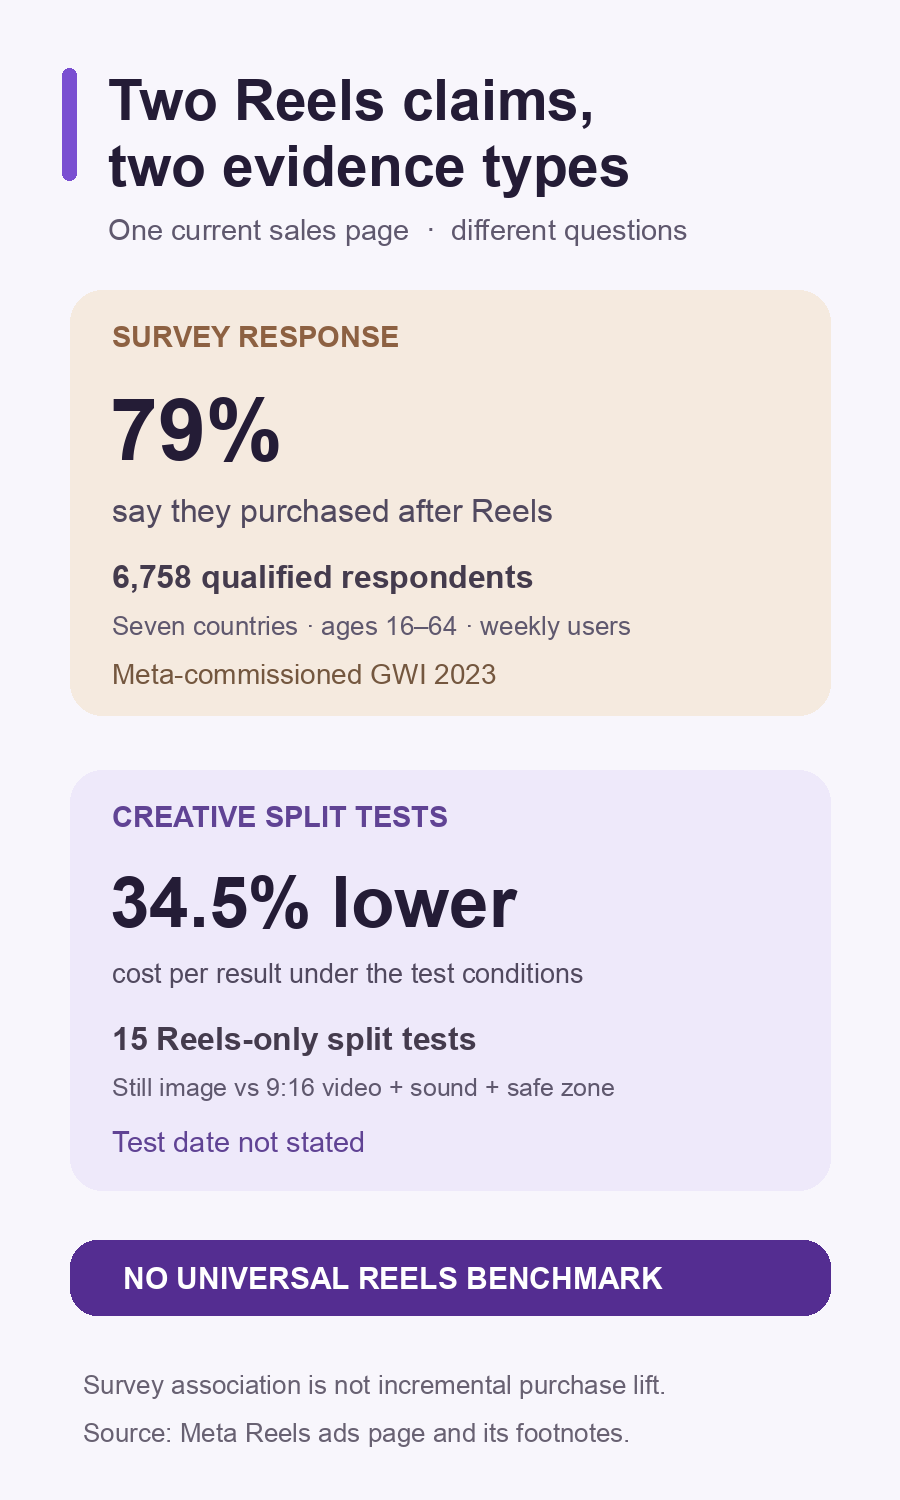
Figure 1. The 79% figure is a Meta-commissioned GWI 2023 survey response among 6,758 qualified consumers in seven countries, not incremental purchase lift. The 34.5% lower cost-per-result figure is a Meta-described analysis of 15 Reels-only creative split tests comparing still image with 9:16 video with sound and safe-zone text. The retained footnote does not state the test date; neither number is a universal current Reels benchmark.
| Page claim | Population or test unit | Period supplied by the source | Outcome actually described | Missing for a buying forecast |
|---|---|---|---|---|
| 79% reported a purchase after Reels | 6,758 heavy short-form-video consumers, ages 16–64, weekly Reels users in seven countries | GWI 2023 | Self-reported purchase after viewing | Ad exposure, counterfactual purchase rate, spend, incremental effect |
| 34.5% lower cost per result | 15 Reels-only split tests, still image versus specified vertical video | Test date not stated | Relative cost per result under those test conditions | Absolute cost, common result definition, date, transfer to other creative and advertisers |
These rows should not share an axis, an average, or a common denominator. “Purchased after watching” and “lower cost per result” are different outcomes. One is survey association; the other is a source-reported test summary with a different unit of analysis.
The survey date is known; the test date is not
The 2023 survey predates Meta’s September 8, 2026 Muse personal-agent announcement, which uses a saved recipe Reel becoming a grocery list as a product example. That announcement shows a newer product idea involving Reels content. It does not re-date the survey, date the 15 creative tests, or establish an advertising performance effect from Muse. A product chronology and an ad outcome study are separate evidence tracks.
This is why the broad claim “Meta’s Reels proof is older than its AI stack” needs care. The survey is dated 2023; the creative-test date is unknown from this page. Treating both as 2023 data would invent a fact. Treating a 2026 agent announcement as evidence that the earlier survey or undated split tests still generalize would make the opposite mistake.
What to ask before using either number
An advertiser considering a Reels creative test can request the details the sales-page summary cannot provide:
- Which result event was optimized, and was it a lead, purchase, view, or another action?
- What were the absolute cost-per-result values, test dates, sample sizes, spend, markets, and placement rules?
- Were the still image and video campaigns assigned comparable audiences, budgets, offers, and attribution windows?
- Did the vertical video have sound and safe-zone text like the reported test condition? If not, the cited comparison is a poor match.
- What happened to qualified business outcomes and incrementality, beyond a platform cost-per-result change?
A small controlled test with a declared conversion definition and business outcome is more useful than adopting 79% as a purchase forecast or 34.5% as a guaranteed cost reduction. The public page provides hypotheses to test and creative details to preserve, not a transferable performance promise.
Method, rights, and correction policy
Violet inspected the retained Meta Reels ads page and its two in-page footnotes, checking the source bytes and exact metric locators against the September 2026 research packet. The 2026 Muse example was checked separately against its retained official announcement, solely for chronology context. The cover and evidence card are original visuals; no Meta footage, brand creative, page screenshot, or logo is republished.
The article cannot determine when the 15 tests ran, whether the surveyed purchases were caused by Reels, or how either figure would perform for a new campaign. Its source map is docs/research/2026-09-23-c5-m9-m10-claim-map-v1.json, the chronology supplement is docs/research/2026-09-23-m10-chronology-v1.json, and the media manifest is docs/research/figures/m10-reels-evidence-media-v1.figure.json. If Meta publishes test dates, definitions, or a corrected footnote, the relevant wording and figure require a dated re-review.
Bring the market problem into focus.
Turn social and market signals into an ecosystem-growth, go-to-market, or technical engagement built around the work your team needs.
Explore engagements